
Maintenance alone costs roughly ₹1.80 to ₹3.00 per kilometre for a mass-market car driven 10,000 km a year. That’s the ₹18,000 to ₹30,000 realistic yearly budget divided by the distance, and there’s nothing more complicated behind it. Scheduled service on its own is far cheaper, about 60 paise per kilometre on a Maruti Swift averaged across five years. Count fuel, insurance and depreciation too and the total is several times higher: one documented six-year Hyundai Venue log worked out to ₹27.61 per kilometre.
All three come out of the same line of arithmetic:
Cost per km = total spend ÷ kilometres driven over the same period
Most owners run it over a year, which makes it annual spend divided by annual kilometres. The Venue case further down runs it over six. Match the two halves and the answer holds. Mix one year of spending with a lifetime’s odometer reading and you’ll get nonsense.
The yearly figures below come from our annual car maintenance cost guide, which holds the full model-by-model tables. This page does the division, and shows you how to run it on your own car.
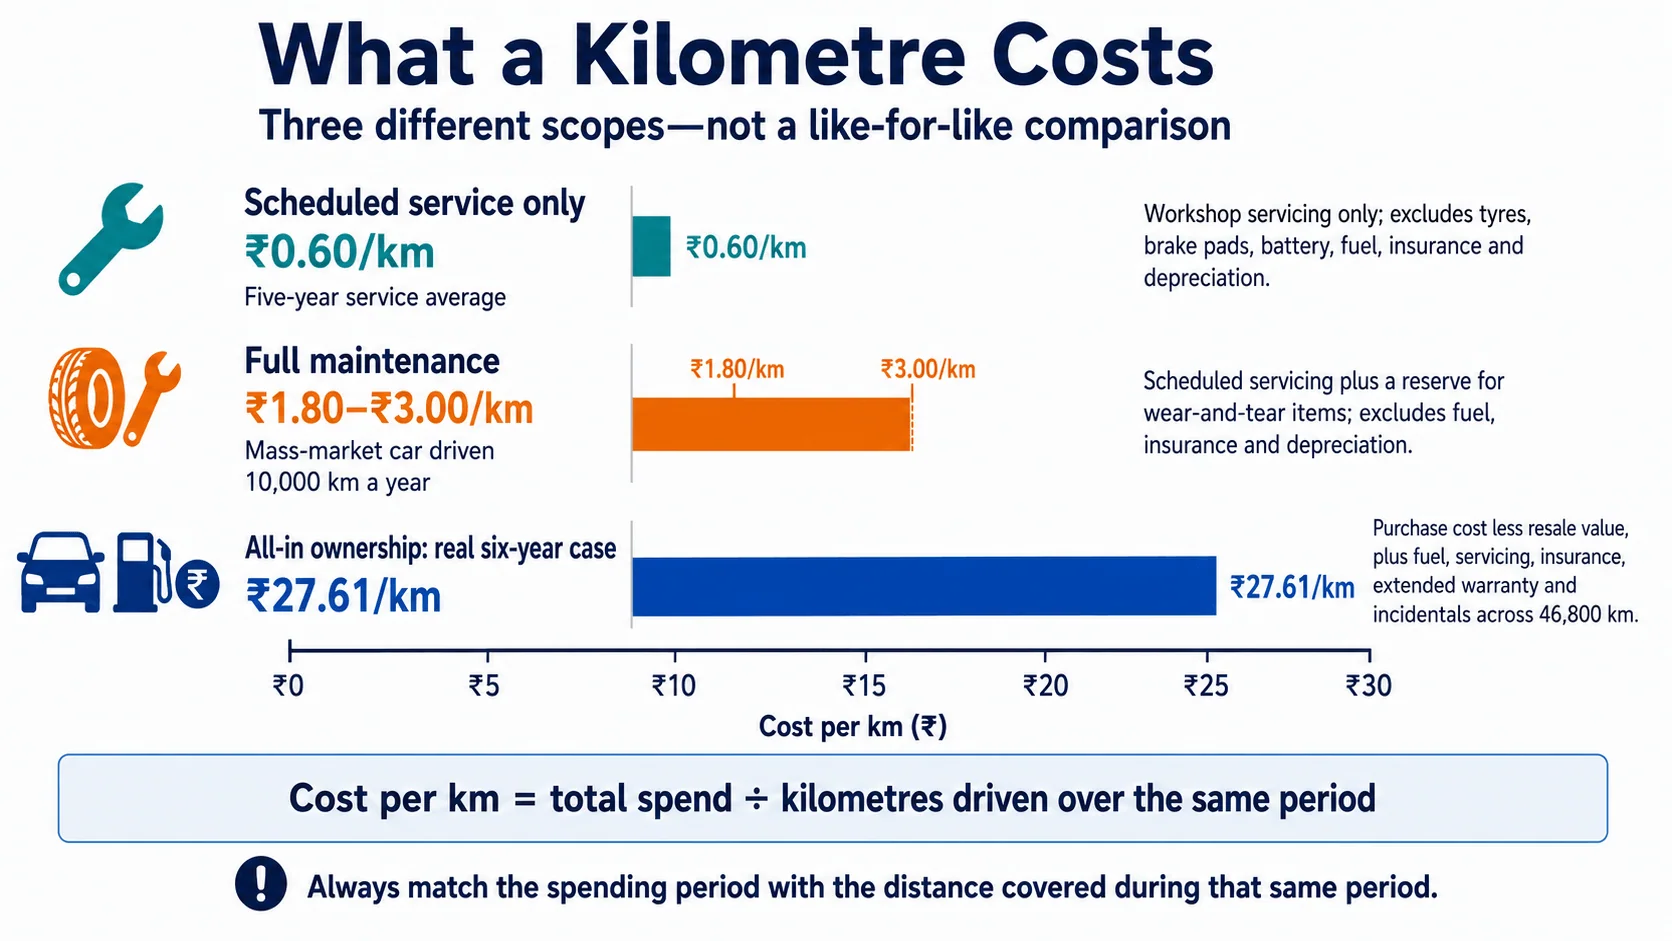
What maintenance alone costs per kilometre
Maintenance here means scheduled service plus a reserve for wear-and-tear items. No fuel, no insurance, no depreciation.
| Annual maintenance cost | At 10,000 km a year | At 15,000 km a year |
|---|---|---|
| Entry hatchback, ₹12,000 to ₹18,000 | ₹1.20 to ₹1.80/km | ₹0.80 to ₹1.20/km |
| Sub-4m SUV, ₹18,000 to ₹26,000 | ₹1.80 to ₹2.60/km | ₹1.20 to ₹1.73/km |
| Mid-size SUV turbo or diesel, ₹28,000 to ₹38,000 | ₹2.80 to ₹3.80/km | ₹1.87 to ₹2.53/km |
| Mass-market car, ₹18,000 to ₹30,000 | ₹1.80 to ₹3.00/km | ₹1.20 to ₹2.00/km |
Both columns take one annual budget and spread it across a different distance, which is the only reason the right-hand one looks cheaper. These are arithmetic scenarios, not forecasts. Brake pads and tyres wear by distance, so a bigger annual bill tends to arrive alongside the extra kilometres, and your own total can land below both columns or above them. Work it out from your own bills.
What the table does show cleanly is that the ₹1.80 to ₹3.00 band isn’t a property of your car on its own. It belongs to your car and your driving together, and that’s why two owners of the same hatchback can quote you wildly different figures and both be telling the truth.
Where the 60 paise figure fits
Our annual guide prices a 2026 Swift’s scheduled service at ₹2,600 in year one, ₹6,000 in year two, ₹5,300 in year three, ₹7,250 for the year-four major, then ₹4,800 in year five. Add those and you get ₹25,950 across five years, which the guide averages at roughly 60 paise per kilometre.
Don’t set that 60 paise directly against the table above. The guide averages it over its own five-year distance, which it doesn’t publish, while the table divides by a stated 10,000 or 15,000 km. Two different denominators.
The bigger gap is scope. Sixty paise buys workshop visits and nothing else. Brake pads, tyres and the 12V battery all sit outside it, so a service-only number will always flatter your budget. Apply that test to any brand’s service calculator too. Check what it counted before you plan around it.
What is the fuel cost per km in India?
Fuel is the heavier line, and it’s the one most owners already have a feel for.
| Powertrain | Real-world efficiency | Fuel cost per km |
|---|---|---|
| Petrol, naturally aspirated | 15 km/l at ₹100 a litre | ₹6.66 |
| Diesel, turbocharged | 20 km/l at ₹90 a litre | ₹4.50 |
| CNG, factory fitted | 25 km/kg at ₹87 a kg | ₹3.48 |
| Electric, home charging | 7 km/kWh at ₹8 a unit | ₹1.14 |
Against the ₹1.80 to ₹3.00 mass-market band, a petrol car burns roughly twice to nearly four times as much at the pump as it spends on upkeep. Pick a different row and that multiple changes. Your own pump price and real efficiency won’t match the table either, so the fuel cost calculator will rework your fuel cost per km on your numbers.
Is diesel cheaper per km?
At the pump, yes. ₹4.50 against ₹6.66 is a gap of ₹2.16 every kilometre, which adds up to ₹21,600 a year at 10,000 km. That holds only at the table’s assumptions, though: ₹100 a litre and 15 km/l for petrol, ₹90 a litre and 20 km/l for diesel. Move any of the four and the gap moves with it.
Whether the saving survives depends on how much you drive, and our annual guide draws that line by usage rather than by price. If your driving is predominantly urban and under 12,000 km a year, the diesel maintenance maths no longer works.
So it comes back to the denominator. Long highway distances are where a diesel collects its fuel advantage. A short city commute isn’t.
What ₹27.61 per km actually counted
Upkeep and fuel are still only part of the cost of owning a car. Our annual guide publishes a documented six-year log of a Hyundai Venue 1.0 SX+ DCT that puts a number on the rest. Bought in 2019 for ₹13,35,767 and driven 46,800 km, it recorded ₹20,41,975 of total cash outflow on the guide’s accounting, covering the purchase itself, fuel, six scheduled services, insurance, an extended warranty and incidentals among the running costs. Estimated resale at the end of year six was ₹7,50,000.
₹20,41,975 less ₹7,50,000 leaves ₹12,91,975. Divide by 46,800 km and the guide’s published result is ₹27.61 per kilometre.
Same formula, wider scope, longer period. Depreciation is the single biggest line inside it, ₹5,85,767 between what the car cost and what it was worth six years later, and that’s the part owners rarely price in. The itemised log sits in the annual guide.
Why is my per-km cost higher than these numbers?
Check your odometer first. That Venue covered 46,800 km in six years, which works out to 7,800 km a year. Depreciation and insurance arrive whether you drive or not, so a low yearly distance spreads those rupees thinner and every per-kilometre figure inflates.
Scope is the other half. A ₹1.80 per km figure and a ₹27.61 per km figure aren’t measuring the same thing. One counted servicing and consumables over a year. The other counted six years of ownership with the purchase price inside it. Before you set your number against someone else’s, check what each of you counted, and over how long.
Work out your own number
- Total your real spend from your records over a period you choose. Decide first whether you’re measuring upkeep only or everything, then hold that line.
- Take the distance covered in that window, straight off the odometer. Don’t estimate it.
- Divide the first by the second.
Do this once a year and the direction of travel will tell you more than any single reading does. When the number climbs, the useful question is which half moved: a bigger bill, or fewer kilometres to spread it over.
Prefer to see it monthly? That’s the yearly spend, divided by 12.